Skip to content

Real Estate Prices and Mortgages

  • Home
  • 10 Key Charts to See Before You Buy or Sell Your Home
  • About Michael David White

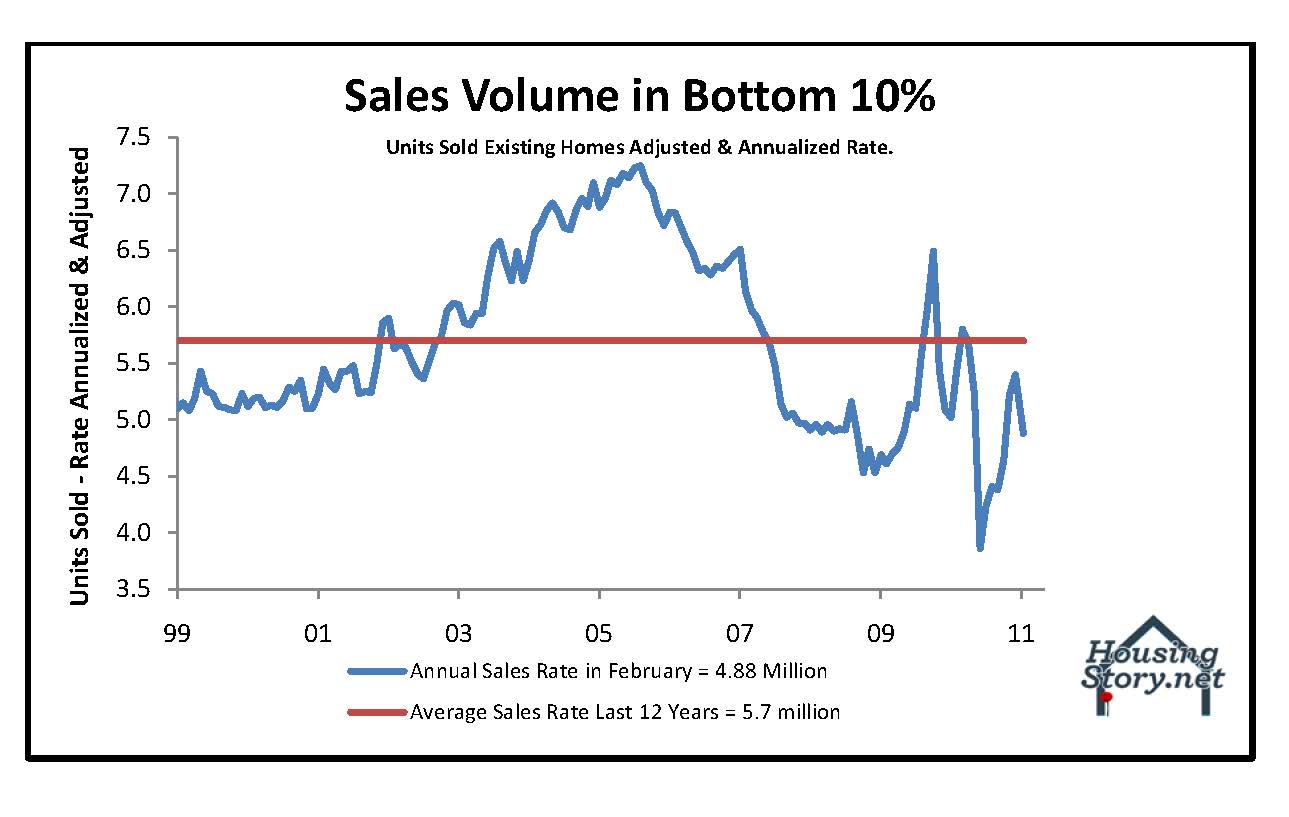
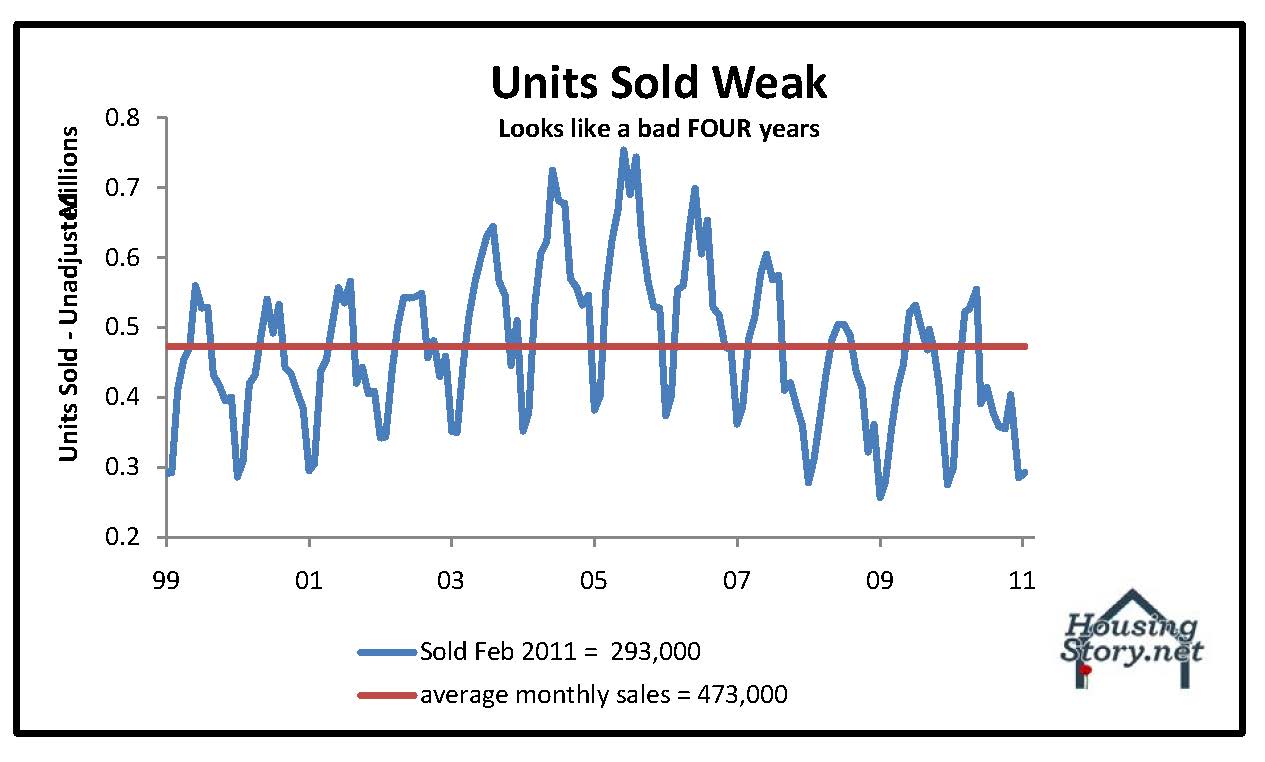
February Sales Volume Falls into Bottom 10 Percent

On March 22, 2011March 28, 2011 By Michael David WhiteIn 10 Key Charts To See Before You Buy A Home, inventory for sale, negative equity, selling your home1 Comment

PRINT Feb 2011 NAR data charts

Posts navigation

Older posts
Newer posts
Website Powered by WordPress.com.
  • Subscribe Subscribed
    housingstory.net
    Join 167 other subscribers

    Have a WordPress.com account? Log in now.

  • housingstory.net
    View site in Reader
    Manage subscriptionsSign upLog in
    Report this content
    Collapse this bar